UrbanStat expands its wildfire risk coverage to new geographies
Chicago, IL – 02/03/2021 | UrbanStat, a leading provider of underwriting solutions for P&C insurance companies, has expanded its proprietary wildfire risk maps’ coverage to 4 more states. UrbanStat Wildfire Risk Map now covers California, Nevada, Arizona, Washington, and Oregon.
UrbanStat platform offers wildfire risk maps via different organizations covering the entire US, Canada and Europe. However, over the years, we started to see that these generalized models didn’t perform well in certain geographies where the wildfires have different characteristics, frequency, and severity. In 2019, we have released our very first version of Wildfire Risk Map for California. Our model has predicted over 90% of the areas that were burned by the most destructive wildfires in 2019 as `High` or worse risk before the wildfire season started. This very same model performed similarly against the most destructive wildfires that occurred in 2020. From a long term perspective (e.g. last 20 years), our model has performed 50% better than the US Forestry’s model in the last 20 years of wildfires.
As we are getting closer to releasing our more specialized wildfire model for other states in the US, we wanted to share some highlights.
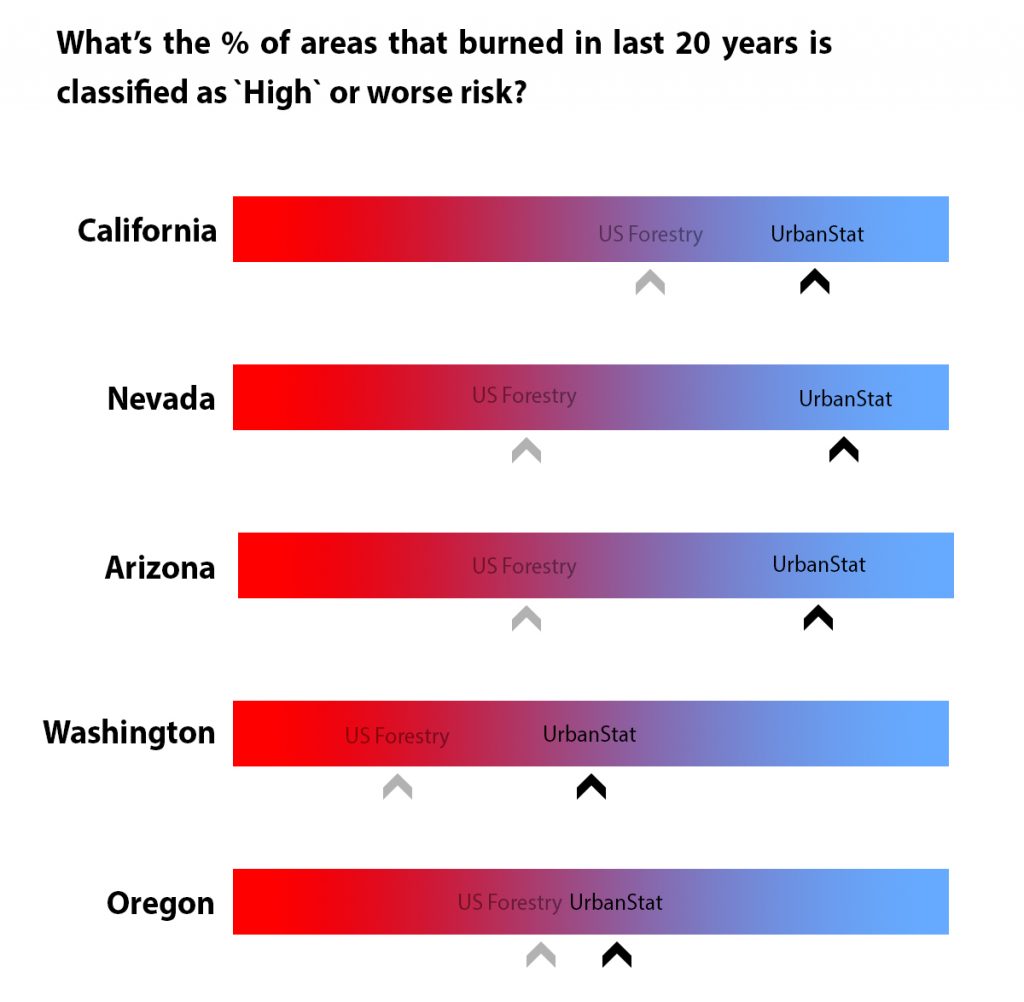
In every state, the UrbanStat model has performed better than the US Forestry’s wildfire hazard map. In Arizona, Nevada, and Washington, the UrbanStat model has doubled the performance of US Forestry. For example, in Nevada and Arizona US Forestry classified about 42% of the areas that burned as `High` or worse risk while the UrbanStat model has classified 84% and 81% respectively. While our model is more accurate in all states, we also classify less or equal amounts of the area as `High` or worse risk compared to the US Forestry. This means the accuracy is not higher because we simply classify more areas as `High` risk.
Similar to our California model, we have utilized over 30 different variables to create this model including characteristics such as solar radiation, lightning strikes, hydrology, wind characteristics, transmission network etc. apart from the usual variables such as slope, access, and fuel.
We know a good portion of the fires in 2019 started due to lightning strike activity and malfunctions on the transmission networks. When we analyzed the importance of the variables, we have seen that as the transmission network voltage increases in the area, the probability of wildfires increases. Similarly, as the lightning strike activity increases, the probability of wildfires increases too. Another interesting finding was as the difference between maximum and minimum temperatures increases the probability of wildfires decreases. Although these types of relationships paint a picture of linearity, the results can be significantly different in different geographies.
When we first built the wildfire risk model for California, we were surprised by the fact that none of the major variables that are commonly used by other risk map providers was on top 5 in the most important variables list. This has not changed in our newest release, where the most important features are about temperature, lightning strikes, solar radiation, and rainfalls as opposed to slope, access, and fuel.
About UrbanStat
UrbanStat helps insurers better predict the “make or break” claims at the time of underwriting. Its core technology – a fully-automated underwriting API – uses a unique ensemble of geographic modeling, statistical modeling, machine learning, and human intelligence. Besides underwriting automation, UrbanStat offers end-to-end analytic solutions that enable underwriters, risk engineers, reinsurance managers, and C-level managers to prepare and access tabular, visual and spatial reports for their portfolio within seconds. For more information, visit urbanstat.com
* We’ve used the term accuracy for simplicity purposes. Our actual performance metrics to assess the model success are F1, AUC, Precision, and Recall.