UrbanStat predicted over 85% burned areas in 2020 before the wildfire season started
Before the wildfire season of 2019, we’ve released our very first wildfire risk map for California. All of our tests based on decades of historical wildfire showed that the “accuracy*” of the model would be over 80% in any given year. However, 2019 wildfire season would truly be a real “blind” test as it was the future not seen by anybody. After the 2019 wildfire season, we published our very first performance report in cooperation with Duck Creek. Our algorithm has classified over 90% of the areas that were burned by the most destructive wildfires in 2019 as `High` or worse risk before the wildfire season started. We’ve been closely monitoring the 2020 wildfire season and as we get closer to the end of the season, we’ve decided to publish our initial results.
In any given year there are thousands of wildfires burning in California. The majority of wildfires are usually very minor and they do not cause property damages or casualties. This year especially is a record breaking year as the total burned area has exceeded 4 million acres. Additionally, 5 of the 6 biggest wildfires since the 1930s have burned in 2020.
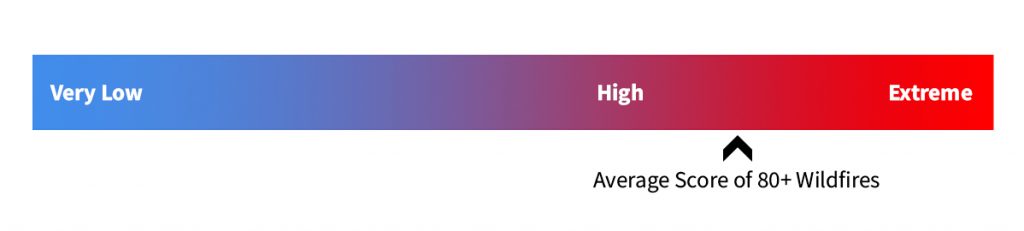
We’ve looked at about the largest 80 wildfires that burned in California this year. The average risk score for any given location was somewhere between `High` and `Very High`.
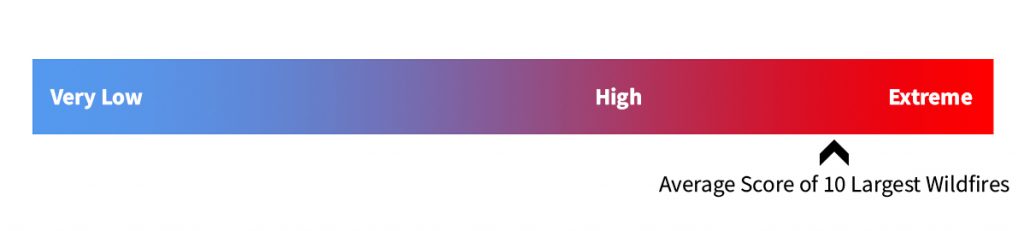
Similar to our 2019 wildfire performance report, we’ve looked at the largest 10 wildfires burned in California as well. The average risk score for any given location was somewhere between `Very High` and `Extreme`.
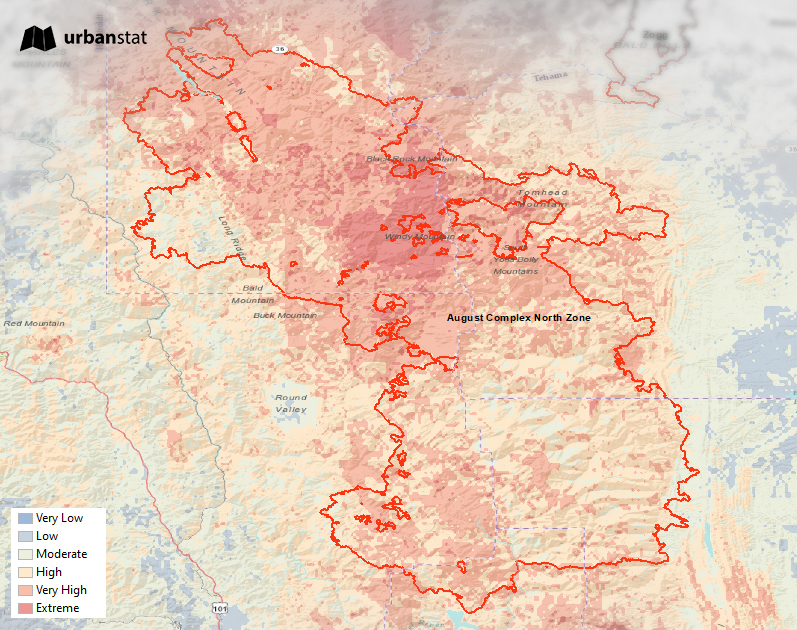
August Complex Fire, the largest wildfire in California since the 1930s, has burned this year and it affected more than a million acre single handedly. As you can see on the map below, UrbanStat Wildfire Risk Map has classified over 90% of this area as `High` or worse risk over a year ago.
A detailed performance report for the most destructive 10 wildfires of 2020 will be released at the end of this year once all the fires are concluded. If you are curious what to expect from this report, you can download our 2019 report here.
So what’s next? Most likely reinsurance companies will limit their exposure in California to the bare minimum as they have been doing since 2017 and insurance carriers will start putting moratoriums on the entirety of affected ZIP codes. What’s going to follow is the moratorium on moratoriums by the state regulators which will cause an overall rate hike for the entire market and loss of opportunity up to 50% in certain ZIP Codes. ZIP Codes are great for a variety of reasons, however, insurance moratoriums are not one of them. However, that’s a topic for another article (which is coming very soon).
About UrbanStat
UrbanStat helps insurers better predict the “make or break” claims at the time of underwriting. Its core technology – a fully-automated underwriting API – uses a unique ensemble of geographic modeling, statistical modeling, machine learning, and human intelligence. Besides underwriting automation, UrbanStat offers end-to-end analytic solutions that enable underwriters, risk engineers, reinsurance managers, and C-level managers to prepare and access tabular, visual and spatial reports for their portfolio within seconds. For more information, visit urbanstat.com
* We’ve used the term accuracy for simplicity purposes. Our actual performance metrics to assess the model success are F1, AUC, Precision, and Recall.