Why should insurers look at La Niña differently?
Between 1955 and 2019, over 350,000 hail events occurred in the US. Research shows that both El Nino and La Nina increases the likelihood of a hail event occurring in the US. In neutral years (neither El Nino nor La Nina), about 4,700 events occur. El Nino increases that number to ~5,100 while La Nina increases it to almost 7,000(~50% increase in frequency). The next question we asked ourselves was whether this is true for all of the US or if there are geographic differences / patterns. Let’s dig into it!
As you can see from the map below, hail is almost everywhere but primarily affecting a region between West, Midwest, and Southwest. This is a map of all hail events between 1955-2019 by ZIP Codes.
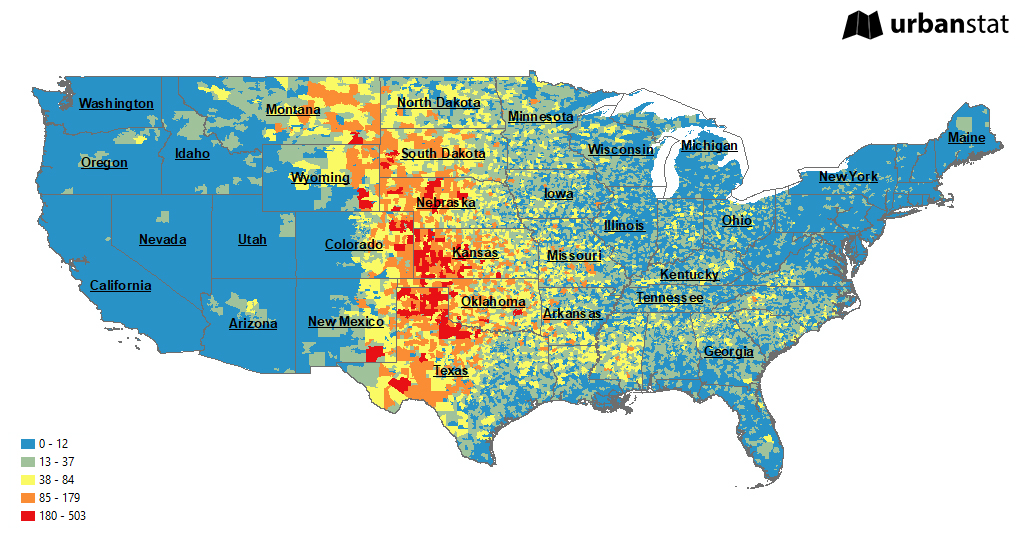
Clearly there is a geographical pattern when it comes to hail events, let’s see if there are temporal patterns as well.
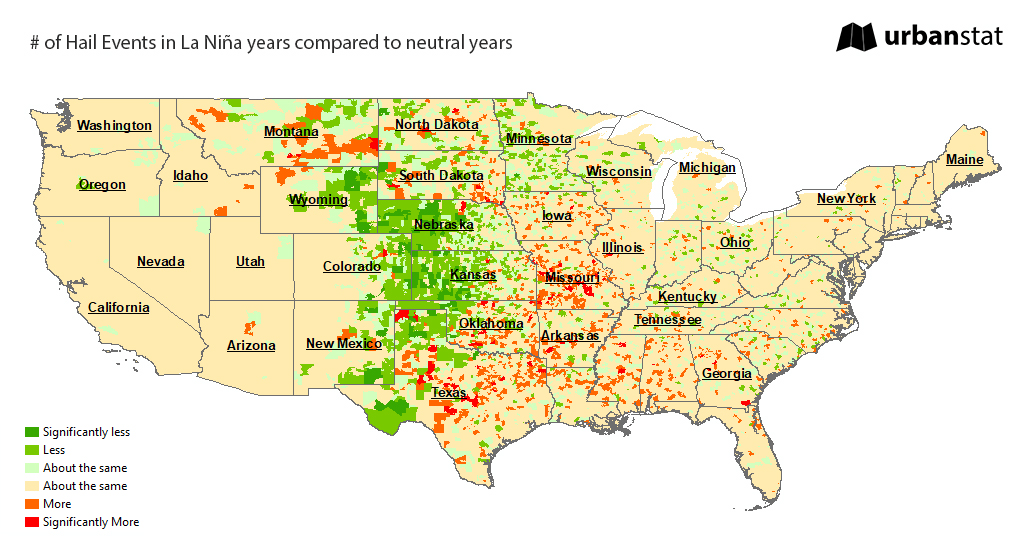
Although the overall frequency of hail events increases due to La Niña, it’s not true for every ZIP Code in the US. As you can see from the map below, quite a few of the states and hundreds of ZIP codes in these states actually experience the opposite.
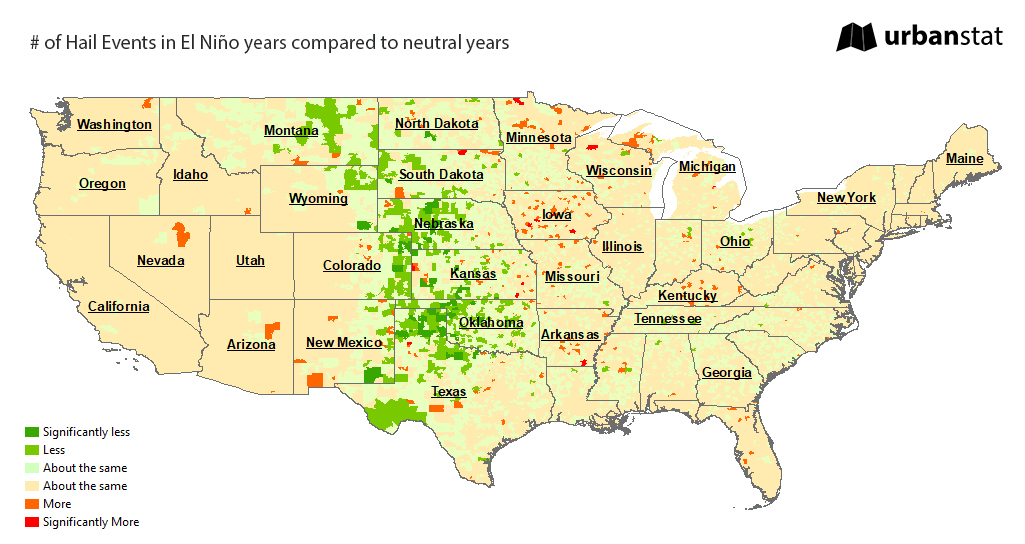
Similarly, El Niño causes decreases in hail events in a number of states and hundreds of ZIP Codes in these states compared to neutral years.
Maps like these could be very misleading when you don’t add demographics into the picture. Let’s see how much of the population in Texas actually benefits from the decrease in hail frequency in La Niña years.
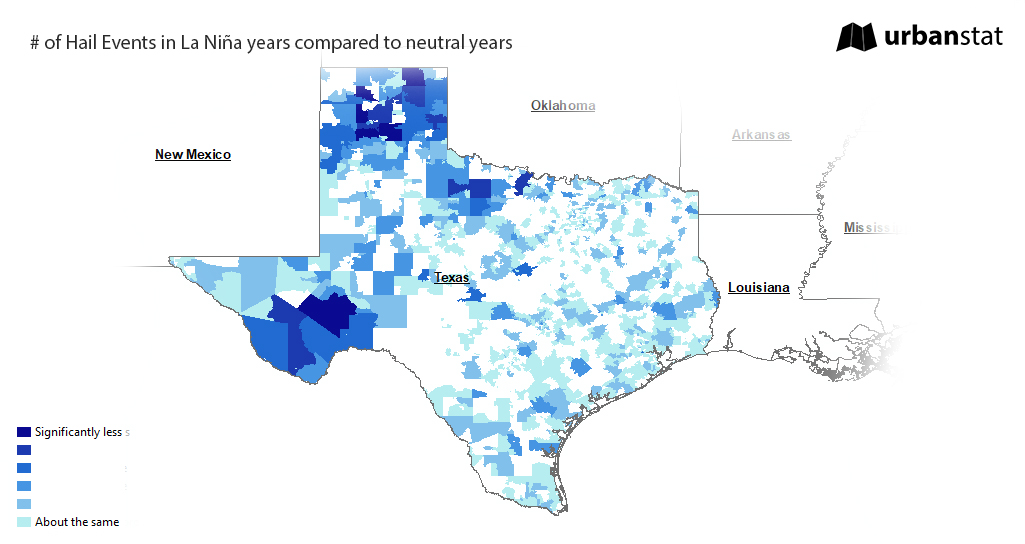
The map above shows the ZIP Codes that have less amount of hail events in La Niña years in contrast to what’s expected (e.g. 50% increase). According to Census 2020 data, about 16.3 million people live in these ZIP Codes which is about 55% of the total population of Texas.
Based on this analysis, it is safe to say that there are opportunities in a lot of places even during La Niña years and it is worth reconsidering La Niña’s effect on premiums. It is crucial to understand geographical and temporal patterns as they could be significantly different from the national statistics.
Our next post on this topic will be about the severity of hail events and if La Niña has any effect on the size of the hail.
If you are interested in learning more about our hail research, do not hesitate to contact us.
About UrbanStat
UrbanStat helps insurers better predict the “make or break” claims at the time of underwriting. Its core technology – a fully-automated underwriting API – uses a unique ensemble of geographic modeling, statistical modeling, machine learning, and human intelligence. Besides underwriting automation, UrbanStat offers end-to-end analytic solutions that enable underwriters, risk engineers, reinsurance managers, and C-level managers to prepare and access tabular, visual and spatial reports for their portfolio within seconds. For more information, visit urbanstat.com