Using ZIP codes costs you, and here is why.
We hate the ZIP codes. We truly hate all administrative boundaries not just ZIP codes when it comes to socio-economics and catastrophe modeling. An arbitrary concept that we have invented to deliver the mail more efficiently became an industry standard to price and underwrite not just the property lines but also auto, health, and life lines. It was very useful when we didn’t have the technology to do things better but those days are gone and they’ve been gone for almost 20 years.
Recently, we have analyzed the opportunity cost of using ZIP codes for underwriting restrictions / moratoriums. This ZIP code area (91350) in Santa Clarita is currently under moratorium by multiple insurance companies. It has a population of 9-10 thousand people.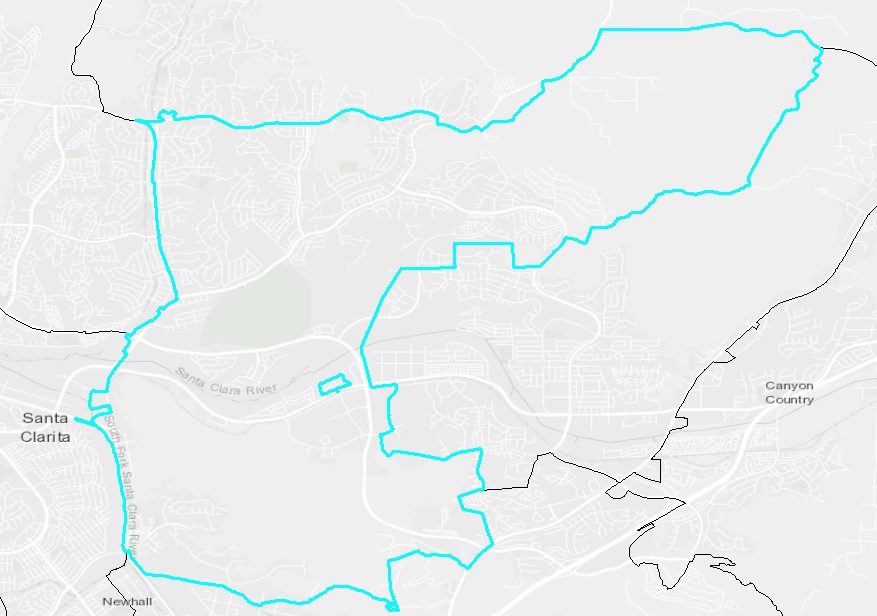
UrbanStat’s Wildfire Risk Map doesn’t care about ZIP codes, however, we can calculate the median risk score of this ZIP code. According to our map, this area is classified as “Very High Risk”.
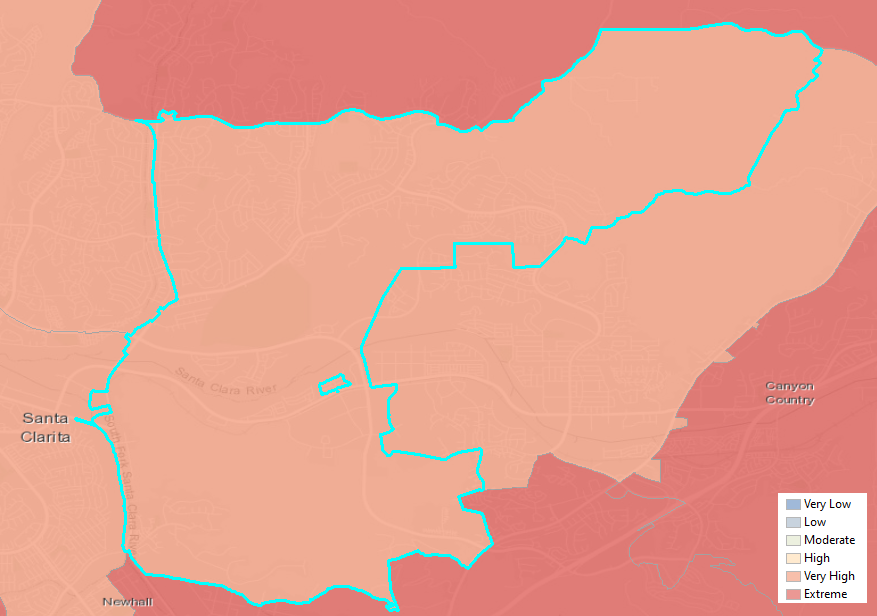
By looking at the risk from ZIP code level, one might believe that insurance companies are doing the right thing by implementing a moratorium here. Adding historically burned areas to the map supports this decision furthermore.
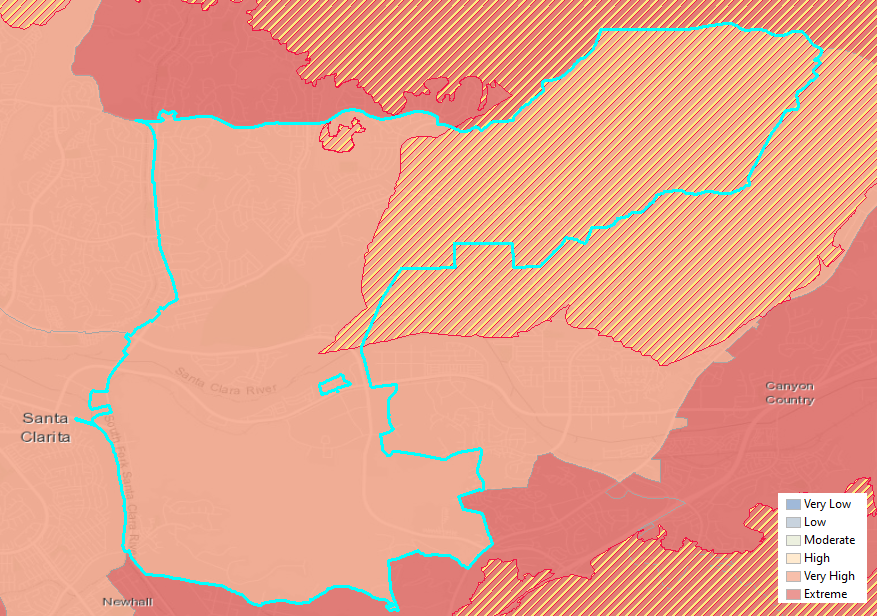
You can easily see that a good portion of this ZIP code was burned and there are other areas surrounding this ZIP code with higher levels of risk and historical wildfires.
This entire story changes drastically when you look at the data from another perspective. Instead of using ZIP codes, let’s use Census Tracts and see what happens!
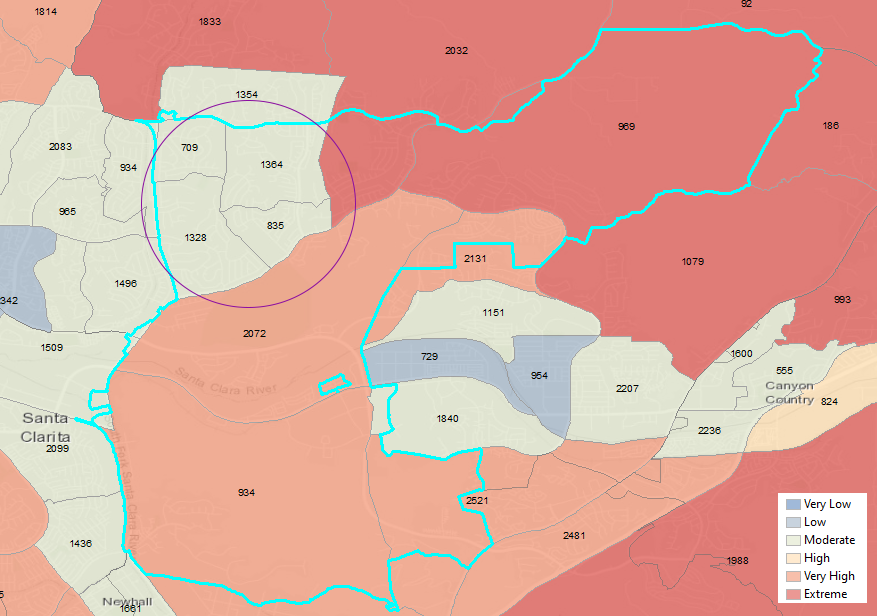
You can immediately see that about 40% of the population is actually in moderate risk areas which is an acceptable level of risk. Our historical analysis shows that only 10% of “Moderate” risk areas have burned in the last 80 years in comparison to 48% for “Very High” risk areas.
Going one step further and using no boundaries at all to represent the risk actually proves that there is even more potential in this ZIP code.
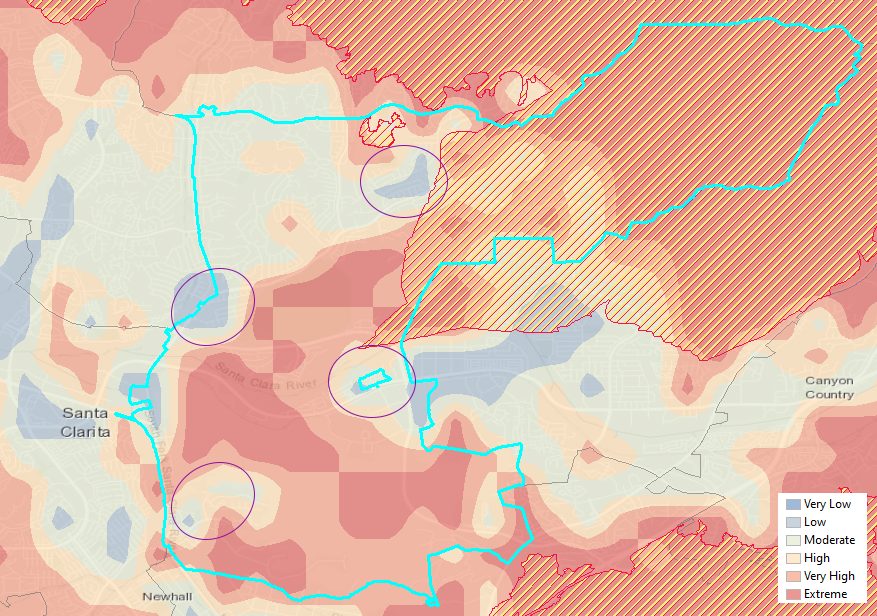
The purple ellipses represent the areas that were previously classified as “High” or worse risk because they were parts of Census Tracts that were overwhelmingly high risk. Using a more granular risk data actually proves that there are “little pockets” of opportunity almost everywhere as well as little pockets of threats (North-West) in areas previously classified as “Low” / “Moderate” risk.
It’s clear that there is really a lost opportunity that is as high as 50%. This opportunity is up for grabs and it’s mostly untouched. The question is who is going to be the first?
About UrbanStat
UrbanStat helps insurers better predict the “make or break” claims at the time of underwriting. Its core technology – a fully-automated underwriting API – uses a unique ensemble of geographic modeling, statistical modeling, machine learning, and human intelligence. Besides underwriting automation, UrbanStat offers end-to-end analytic solutions that enable underwriters, risk engineers, reinsurance managers, and C-level managers to prepare and access tabular, visual and spatial reports for their portfolio within seconds. For more information, visit urbanstat.com