
Lemonade’s 2Q2020 results unpacked: the good and the bad
Insurtech Lemonade (LMND) announced its Q2 results today, their first as a public company. The results showed significant improvements quarterly year over year in several key metrics. But is comparing Q2 2020 to Q2 2019 a fair comparison? Not only was the second quarter of 2020 one with significant dislocation to the country due to Covid-19, but in 2019 Lemonade was a pre-public company and it was a time when many Insurtechs were focused on growth at all costs.
Sweet high-level reported results
At a high level, their in-force premium increased to $155M from $72M in 2Q2019. That is a 115% increase YOY. However, that is only half the growth of what their Q2 increase from 2018 to 2019 was (208% vs 115%). The YTD in-force premium is $39M over where they ended 2019 (34% increase). (See Figure 1)
They are seeing a continued increase in premium dollars per customer to $190/customer, mostly driven by the increase in the number of new homeowner policies and the aging of their rental customers who pay more in premium in each successive year of coverage.
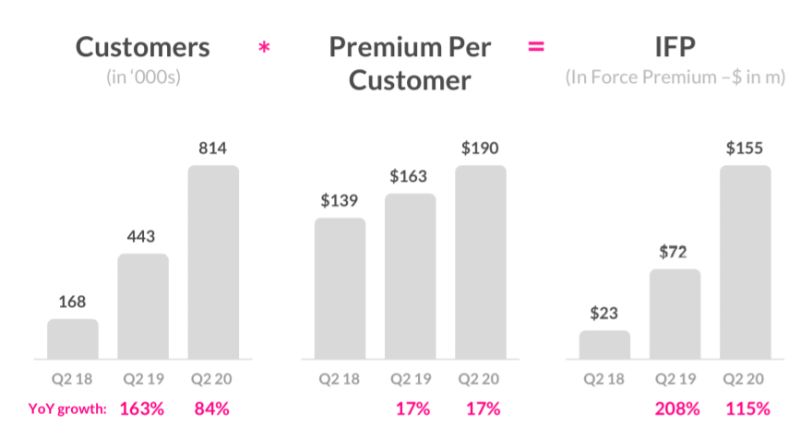
Figure 1: Quarter over Quarter Results
They have also seen a steady decline in loss ratio to 67% in 2Q20, a number more in-line with the industry (Figure 2). According to the investor call, this is partially driven by the lower loss ratios of homeowners vs renters.
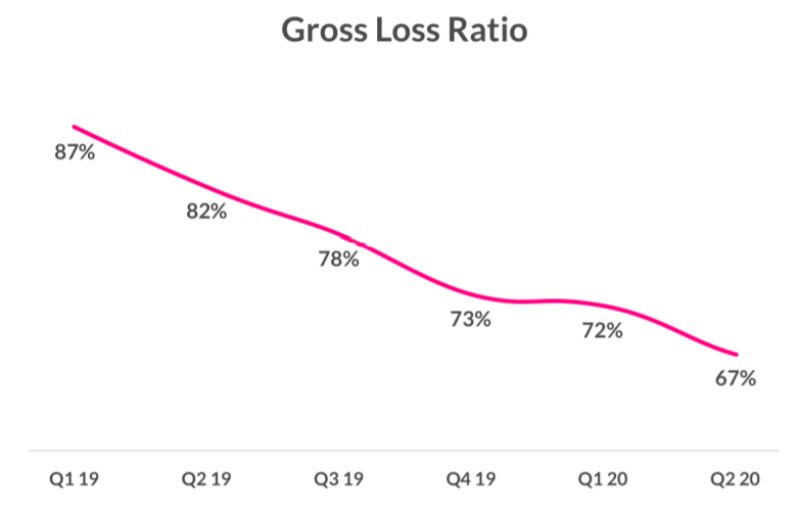
Figure 2: Gross Loss Ratio
They have also launched a pet insurance product which starts at about $10/month and is available in 30 states. They built the product from scratch (including pricing and a new simplified policy document). They provide a 10% bundle discount for current renters or homeowner policyholders. The pet insurance product currently has an NPS of 80, compared to 70 for their traditional products. Still, the number is remarkably high, and the bundling should help strengthen retention rates.
Data is key
Many times, during the shareholder call, Lemonade mentioned the fact that they generate and use 100x more data than broker-based carriers. This is a structural and growing competitive advantage. By being digital-first, they have created a digital infrastructure that uses AI within a closed-loop system that constantly reinforces itself. Data from one interaction can inform every other interaction. Marketing campaigns become better, fraud detection picks up the faintest signals, etc. While they did not explicitly bring examples here, they can fine-tune processes on the fly, which allows them to more quickly react than a traditional incumbent carrier.
Some tartness in the numbers
Their stock price has not fared as well (Figure 3). After jumping 140% upon listing, they have seen a steady decline over the last month. Additionally, the volume of trades has dropped well over 170% from the first week of trading. Besides, much of the early jump in share price seems to be driven by individual investors who feared they would miss out (FOMO).
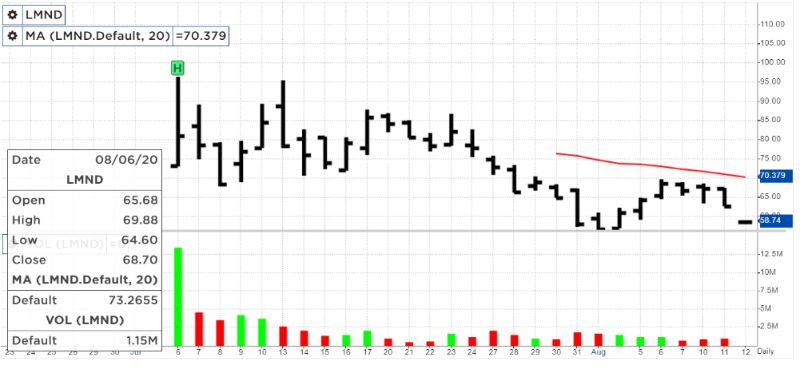
Figure 3: Lemonade Stock Price
Investors in Lemonade are not traditional insurance investors. Lemonade has positioned itself as an anti-insurance company that sells technology/software as a service (SaaS). Investors in SaaS companies look for different metrics and dynamics. As such, we cannot compare an Allstate investor to a Lemonade investor. So, do not compare your results to Lemonade and wonder why people are investing in them.
Two critical metrics Lemonade has not reported are customer acquisition costs (CAC) and customer lifetime value (LTV). I have tried to estimate these since they are critical numbers that technology investors look at. Also, the ratio of customer acquisition cost (CAC) to lifetime customer value (LTV) helps investors understand if a company is losing money on customers (ratio <1) or making money on them (ratio > 1). VCs typically look for LTV/CAC ratios of > 3 to fund a growth financing round.
Lemonade has been lowering its CAC costs each quarter from 2018 to $190 in 2Q20 (Figure 4). Using their reported premium per customer and their reported gross profit margin, we can calculate a gross margin per customer which has increased since early 2019 and has stabilized around $34/customer. If we use their retention rates stated in the S1 of 61% and gross it up to 75% (for simplicity and realizing that premium retention rates are better for larger customers), that means an average customer stays with them for 4 years. This means they can expect to earn between $130 – $140 per customer over their lifetime with Lemonade.
When we calculate Lemonade’s LTV/CAC ratio, we see that it has been improving. It now stands at 72%, which means they still lose money on each customer. In comparison, Allstate has an estimated LTV/CAC ratio > 7.
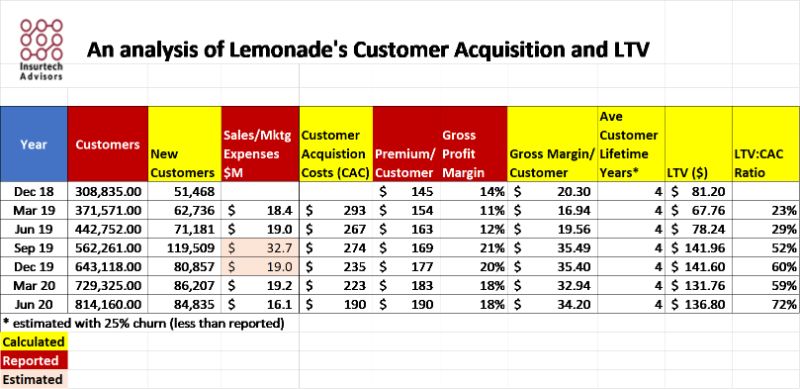
Figure 4: Customer Acquisition Costs and LTV
Why comparing 2Q2020 with 2Q2019 hides a slowing of growth
Unlike the comparisons published with the Shareholder’s presentation, when looking at the quarterly results published in Lemonade’s Shareholder letter, we see a slowing of growth quarter over quarter or year over year from March 2019 thru June 2020 across all metrics except for losses in the last quarter (Figure 5).
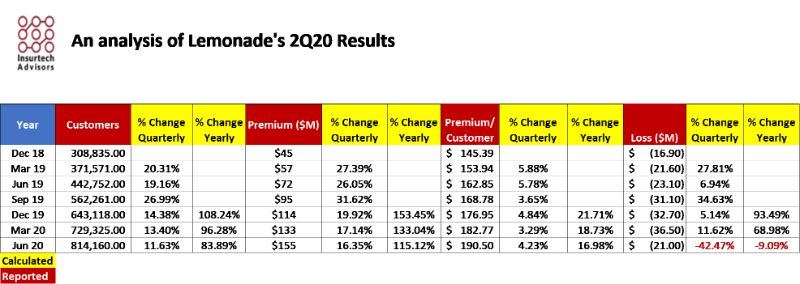
Figure 5: Quarterly Results
Customer growth has slowed 35% from an average of 17.65% quarterly growth to just 11.63% in 2Q2020. Premium growth has slowed 29% from an average quarterly growth of 23.08% to 16.35%. Premium per customer growth has slowed 8% from 4.61% average quarterly growth to 4.23% growth in 2Q2020.
In Lemonade’s shareholder letter they say that retention rates held steady and that about 1% of their customers opted to defer payments. That is about 8k customers, most of whom are paying little for their insurance cover who deferred payments. Also, from their S1 filing, we know that their year 1 retention rate was 61% and year 2 retention rate was 71% for a combined 2-year retention rate of about 44%. It is great that it was stable, but I would not say that their retention rates are strong!
Are Re-Insurers being smart?
Lemonade’s new re-insurance contracts free them up from capital requirements which are great and reduces their margin volatility (Figure 6). For every dollar of premium written, they cede $75 to reinsurers, who in turn pay a $19 commission back to Lemonade (25%). This means the reinsurers are working on a gross margin of just over 6%. When a claim arises, both the carrier and the reinsurers pay proportionately. So, based on an expected 70% loss ratio, for every $100 in premium, we expect $70 in losses. The reinsurer would pay $52.5 and Lemonade $17.5. This arrangement leaves Lemonade with approximately $27 for all other expenses and profit.
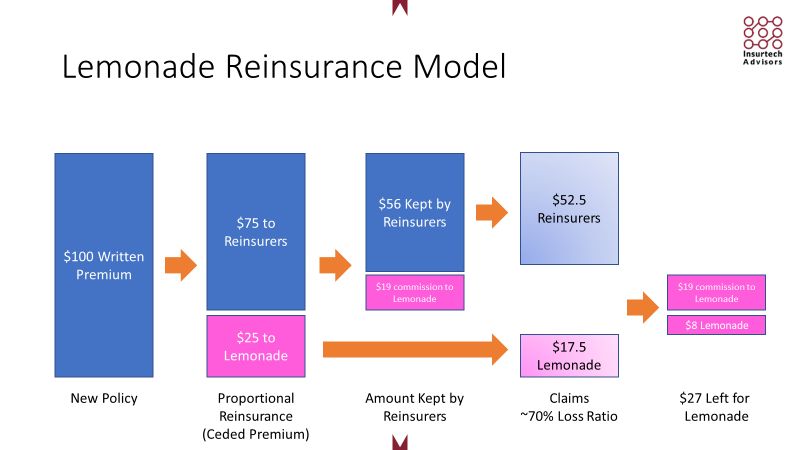
Figure 6:Lemonade’s Reinsurance Model
What do Lemonade’s 2Q2020 results mean for you?
Lemonade launched a new product (Pet Insurance) and a new Country during the Covid-19 pandemic when everyone was working from home. This agility positions them strongly to continue to test, learn, and launch at a speed that most incumbent carriers cannot match. Add to this their more normal loss ratio and they are well-positioned to grow.
- What does this mean for a legacy carrier? Lemonade will not be a threat for many more years to come unless they also crack the nut into selling homeowners and other insurance products.
- How can we compete with Lemonade? You need to improve your renter’s product and develop an approach where independent agents can profitably sell a renter’s policy or experiment with selling the product directly or through partnerships. Without this, Lemonade will continue to dominate new insurance buyers and that will give them a potential advantage as renters transition to homeownership.You should also explore using technological advances coming out of the Insurtech space such as conversational AI, prefill, fraud detection, and others. These advances will help you maximize your value to agents, policyholders, and staff.
Feel free to reach out if you want to discuss their quarterly results or if there is anything else you are wondering about.
About Insurtech Advisors
Insurtech Advisors is dedicated to helping regional insurance carriers and agencies find and partner with Insurtechs enabling you to thrive and continue to meet the needs of your members and independent agents. We work closely with your team to identify opportunities and aspirations and then personally curate and introduce you to the best Insurtechs to pilot.