

Florida’s New Property Litigation Is Falling. Claims Leaders Still Have an Inventory Problem.
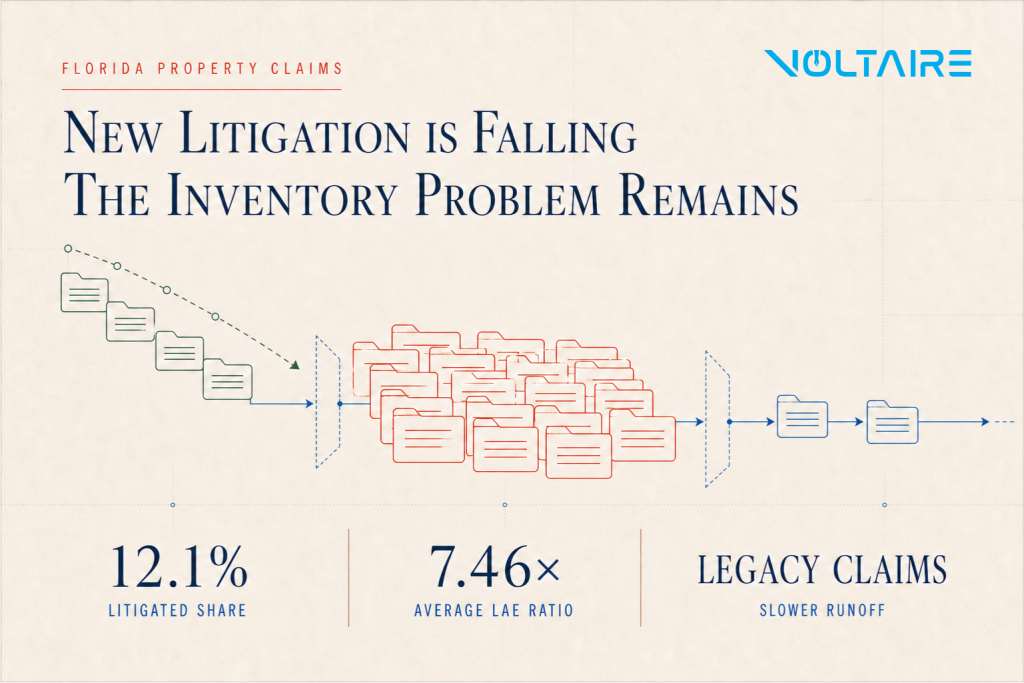
Florida carrier leaders have a better litigation environment and a stubborn operating problem. New-suit indicators are falling, yet litigated claims represented 12.1% of residential property closures with known status in 2025 and carried more than seven times the average loss adjustment expense of non-litigated closures, according to OIR’s July 2026 Insurer Stability Report.
Reform can improve the front door while claims teams continue spending disproportionate time and expense resolving older litigated inventory. OIR’s data show why carriers need to measure both.
We recently assembled OIR’s residential Property Claims & Litigation Report data for closure years 2022 through 2025 in a full Voltaire Research study. The result is a useful warning for insurers, regulators, analysts, and technology companies: a lawsuit entering the system, a loss occurring, and a claim leaving a carrier’s inventory are different events. If we collapse them into one number, we can make a reform look more successful or less successful than the evidence supports.
The measured picture is more interesting than either slogan. New-suit indicators are moving down. At the same time, litigated claims have been leaving carrier inventory more slowly than the much larger population of non-litigated claims. The remaining litigated inventory is concentrated in wind and water perils, geographically less concentrated than it was, and disproportionately expensive to resolve.
For carrier leaders, that is not an abstract measurement dispute. It changes how claims capacity should be planned, how litigation results should be reported, and where operating improvements still matter after a legal reform changes the inflow.
Florida litigation data run on three clocks
The first clock is loss year, the year in which property damage occurred. Loss-year data are the right starting point when the question is: what share of a cohort of claims ultimately litigates?
The second clock is suit-open year, the year in which litigation began. That is the appropriate basis for asking whether new litigation inflow is rising or falling.
The third clock is closure year, the year in which the insurer closed the claim. Closure-year data answer a different question: what kinds of claims are leaving carrier inventory now, and what workload and expense do they represent?
Those questions are related, but they are not interchangeable.
Imagine a simple carrier inventory. New litigated claims can enter more slowly after reform, while older litigated claims continue to mature, move through discovery, settle, and close. If non-litigated claims are also closing much faster, litigated claims can become a larger share of the claims leaving the system even as the number of new suits declines.
That is the basic reconciliation in Florida.
OIR itself now draws essentially this distinction. Its July 2026 Insurer Stability Report describes closure-year reporting as an exploratory operational snapshot and introduces a loss-year view of HO3 claims. The two views do not compete. One describes the composition of the outflow. The other begins to track how cohorts develop.
This matters because Florida’s December 2022 property insurance reforms are often discussed as if every subsequent data point were a referendum on the legislation. A closure-year series cannot carry that weight. Claims closed in 2025 may arise from losses reported years earlier, and OIR explicitly notes that the annual closed-claim population includes current and prior hurricane claims.
The first discipline, then, is simple: name the clock before naming the conclusion.
The denominator did more work than the headline admits
The statewide closure-year totals show why this distinction matters.
OIR reported 732,390 closed residential property claims in 2022 and 456,200 in 2025, a decline of 37.7%. Litigated closures fell from 58,395 to 53,413, a much smaller decline of 8.5%. Over the same period, policies in force grew by roughly 6%, from about 7.27 million to 7.71 million. The market did not simply shrink in parallel. What collapsed was the volume of claims being closed.
Those figures come from OIR’s January 2024 Property Claims & Litigation Report, January 2025 Insurer Stability Report, January 2026 Insurer Stability Report, and July 2026 Insurer Stability Report.
When litigated claims decline far more slowly than total closed claims, the litigated share rises. On the raw basis, litigated claims increased from 7.97% of all closures in 2022 to 11.71% in 2025, a gain of 3.74 percentage points.
That is a real calculation. It is also an incomplete comparison because reporting quality changed dramatically.
In 2022, OIR’s data showed 139,257 closed claims with unknown litigation status, 19.01% of the entire population. By 2025, unknown status had fallen to 14,856 claims, or 3.26%. Better status completion mechanically raises the raw litigated share because far fewer claims of unknown status remain in the denominator.
Conditioning on claims with known status gives the more useful like-for-like descriptive comparison. On that basis, the litigated share increased from 9.85% in 2022 to 12.10% in 2025, a gain of 2.26 points. Approximately 40% of the raw point increase disappears after conditioning on whether litigation status was reported.
This does not make the known-status rate “corrected truth.” Missing status may not be random. Claims without a reported status may differ systematically from claims with one. If every unknown-status claim were assumed non-litigated, the full-population rate would be 7.97% in 2022 and 11.71% in 2025. If every unknown were assumed litigated, the rates would be 26.99% and 14.96%, respectively. Those ranges overlap, which means the public data alone cannot prove that the underlying litigation propensity of the full population increased.
What can be said is narrower and stronger:
- The raw share of closed claims identified as litigated rose from 7.97% to 11.71%.
- Among claims with reported status, the litigated share rose from 9.85% to 12.10%.
- Status reporting improved sharply, and that improvement accounts for roughly 40% of the raw point increase.
- The volume of litigated closures fell, but much more slowly than the total volume of closures.
An exact accounting identity makes the last point visible. Between 2022 and 2025, litigated closures declined by 4,982. The change can be split into a negative closure-volume component of 22,021 claims and a positive rate component of 17,039 claims, with no residual. In plain English, sharply fewer claims closed, which pulled the litigated count down, but a larger litigated share of that smaller closing population offset most of the decline.
That is accounting, not causation. It does not tell us whether legal reform, catastrophe development, carrier mix, reporting changes, closure speed, or another factor produced either component. But it tells us why “litigation fell” and “the litigated share rose” are not opposing statements.
The measured increase sits in wind and water
The statewide average also hides a striking peril pattern.
On the preferred known-status basis, the litigated share of hurricane closures increased from 6.18% in 2022 to 12.56% in 2025, a gain of 6.38 points. Non-hurricane windstorm or hail increased from 13.33% to 16.93%, a gain of 3.60 points. Other-water claims increased from 13.11% to 15.59%, a gain of 2.48 points. These figures are calculated from the peril tables in OIR’s 2022 and 2025 closure-year publications.
The other five peril categories were flat or lower. Accidental discharge or overflow of water or steam fell 2.63 points on the known-status basis. Fire or lightning fell 0.65 points. The all-other category fell 2.56 points. Falling-object claims fell 5.18 points. Sinkhole fell 16.84 points, although the sinkhole population was very small, only 319 closed claims in 2022 and 263 in 2025.
This is not a general rise across the claim book. It is a concentrated wind-and-water result.
The pattern is consistent with legacy catastrophe cohorts closing in litigated form. Florida catastrophe claims can develop slowly through late reporting, reopening, dispute, and litigation. The December 2022 reform was not retroactive, so pre-reform claims continued to move through the prior legal environment.
“Consistent with” is doing important work in that sentence. Closure-year peril data do not identify the loss year of each claim. Without loss-year-by-peril rows, we cannot attribute the increase to Hurricane Ian, another specific storm, or the reform itself.
Still, the operating implication is hard to miss. A carrier can experience fewer new litigated claims while its closure team, counsel, adjusters, and reviewers remain occupied by older wind and water files. The problem facing that organization is no longer only inflow. It is the cost and speed of working the remaining inventory to a defensible conclusion.
That should influence CAT readiness. Staffing models built only from new claim counts will understate the work if aging litigated cohorts consume more handling time, legal expense, review attention, and correspondence effort than ordinary closures.
In Voltaire’s recap of a Connected Claims discussion with Heritage Insurance, Heritage’s claims leadership described adopting Voltaire during CAT season and seeing improvements in claim-letter speed, throughput, quality, and adjuster experience. That is the kind of operating evidence claims leaders should demand: a bounded use case, observed in the environment where capacity matters.
It should also influence how claims technology is evaluated. The relevant question is not whether software can declare victory over litigation. It cannot. The practical question is whether it can remove time from policy-language lookup, correspondence assembly, citation, formatting, and repetitive review so experienced professionals have more capacity for difficult files.
At Voltaire, that is the part of the problem we work on. We help claims organizations complete policy-supported correspondence faster and with less manual drafting and template work. I would not claim that a faster letter caused Florida’s litigation trend. I would claim that when litigated inventory is slow, expensive, and concentrated in complex perils, reducing avoidable drafting and review drag is a rational capacity investment.
The geographic gap narrowed, but the problem did not simply migrate
Florida’s tri-county region, Palm Beach, Broward, and Miami-Dade, remained the state’s dominant closure-year litigation hotspot. Its known-status litigated rate was 27.50% in 2022 and 27.27% in 2025. The count of litigated closures fell from 28,653 to 20,407, a decline of 28.8%.
Outside South Florida, rates increased. Central Florida moved from 9.90% to 14.01%. All other counties moved from 5.40% to 8.16%. The tri-county premium over the rest of the state narrowed from 22.1 to 19.1 percentage points, and from 5.1 times the rest-of-state rate to 3.3 times. The regional series appears in OIR’s 2022 PCLR and subsequent Insurer Stability Reports.
It would be easy to summarize that as litigation migrating north. The counts do not support such a clean story.
Central Florida’s litigated closures rose only 3.7%, from 7,171 to 7,436. Its non-litigated closures fell 30.4%, from 65,612 to 45,639. Policies in force in the region grew 13.4%, from 846,647 to 959,900. Most of the rate increase came from a shrinking denominator, not a surge in the numerator.
The larger absolute increase in litigated closures occurred across “all other counties,” where the count rose 13.3%, from 22,571 to 25,570.
The defensible interpretation is that litigated closures became less concentrated in the tri-county region. It is not that Central Florida inherited South Florida’s problem, and it is certainly not that the tri-county region stopped being the hotspot. At 27.27%, its 2025 closure-year rate remained nearly twice Central Florida’s and more than three times the rate across all other counties.
This is another example of the denominator deciding the headline. Regional claims leaders need both the rate and the count. A rising rate with a nearly flat litigated count calls for a different response than a rising rate driven by rapidly expanding litigated volume.
Falling inflow does not erase expensive inventory
If closure-year data cannot establish the effect of reform, what evidence points to a decline in new litigation?
OIR’s July 2026 report provides several indicators. Legal Service of Process filings fell 23% in 2024, 25% in 2025, and another 25% year to date in 2026. Average defense cost per claim fell from $947.38 to $720. Florida’s preliminary share of national homeowners suits in the Market Conduct Annual Statement data fell from 73.15% to 41.29%.
None of those measures is a clean causal evaluation of SB 2-A. Together, however, they point toward declining new litigation inflow. Ignoring them would be as misleading as using them to explain every claim closed in 2025.
The closure-year data describe the inventory still being resolved, and that inventory remains expensive.
OIR reported average 2025 loss adjustment expense of $15,257 for litigated closures and $2,044 for non-litigated closures. That is a 7.46-to-1 difference. Applying those averages to the 2025 known-status closure counts produces a rough estimate of $814.9 million in LAE for litigated closures and $792.9 million for non-litigated closures.
In that derived estimate, litigated claims were about 12.1% of known-status closures but accounted for approximately 50.7% of estimated LAE. This is not an OIR-published aggregate and should not be presented as one. It is an estimate created by applying OIR’s stated average costs to the reported counts. Even with that caveat, the order of magnitude is useful: a small portion of closing inventory can consume about half of the associated adjustment expense.
This is why the stock-and-flow distinction is more than a statistical nicety. A healthier inflow does not make the old inventory free. It changes the operating problem from one of unchecked accumulation to one of disciplined runoff.
Carriers need to manage both:
- The flow: new suits, notices, service of process, attorney involvement, and the litigation rate of newer loss cohorts.
- The stock: open litigated claims by age, peril, geography, reform regime, procedural stage, expected closure date, legal expense, and correspondence workload.
A reform-success dashboard that tracks only new suit volume can miss the cost still sitting in the building. A litigation dashboard that tracks only the share of claims closing with litigation can miss genuine improvement at the front door.
The right management view keeps both measures visible and refuses to make one answer the other’s question.
The loss-year snapshot is promising, not conclusive
OIR’s July 2026 report adds a loss-year view for closed HO3 claims. On that basis, the statewide litigated share falls monotonically across newer loss years: 8.9% for 2022 losses, 6.4% for 2023, 2.8% for 2024, and 1.3% for 2025.
The regional patterns point the same way. In the tri-county region, the reported share falls from 24.1% for 2022 losses to 2.0% for 2025 losses. In Seminole, Orange, Lake, and Osceola counties, it falls from 9.3% to 1.4%.
That is encouraging. It is not yet a trend.
The July report provides one observation vintage. Newer loss cohorts have had less time for disagreements to mature into litigation, a problem known as right-censoring. The claims that have already closed from a young cohort are also more likely to be the simpler, faster, non-litigated files, a problem of selective closure.
Reading the downward gradient as a reform effect would be the loss-year version of the same mistake made when a closure-year rate is treated as new-suit inflow.
A credible comparison requires successive reporting vintages or underlying claim-level rows. We need to compare cohorts at the same development age. How did the 2023 loss cohort look after 12, 24, and 36 months? How does that compare with 2022 at the same maturity? Did the relationship hold by peril, geography, carrier type, and policy form?
There is also a population mismatch. The loss-year charts cover HO3 policies only. The closure-year PCLR totals cover a broader personal and commercial residential property population. The two series are valuable conceptually, but they are not directly comparable numerically.
OIR deserves credit for introducing the loss-year view. The next step should be to publish it as a repeatable development series rather than a single snapshot embedded in chart images. A public triangle or cohort table would let the market separate maturity from behavior and replace dueling headlines with a more disciplined evaluation.
What the industry should do with the evidence
I think the Florida data support five practical changes.
First, every litigation statistic should carry its clock in the label. “Litigated share” is not enough. Call it the share of claims closed in calendar year 2025 that were identified as litigated. Call another number new suits opened in 2025. Call a third the realized litigated share of the 2023 loss cohort measured at a stated development age.
Second, publish rates with counts and denominator quality. Florida’s 2022-to-2025 raw rate rose 3.74 points, while the known-status rate rose 2.26 points. Both belong in the discussion. So does the decline in unknown status from 19.01% to 3.26%. A percentage without the underlying count and missing-data rate invites a story the data may not support.
Third, manage legacy litigated inventory as a distinct operating book. Segment it by age, peril, geography, procedural stage, and legal regime. Estimate how much adjuster, counsel, review, and correspondence capacity it will require. New inflow can improve before that inventory releases its hold on the operation.
Fourth, attack controllable handling time without pretending that operations caused the macro trend. Faster claim-letter drafting, easier policy-language retrieval and assembly, consistent formatting, and less repetitive review may produce fewer lawsuits. They give claims organizations more capacity to move complex files, respond promptly, reduce avoidable rework, and prepare for catastrophe volume while experienced people remain tied up in litigated inventory.
Fifth, demand an equal-maturity reform analysis. Successive loss-year vintages, observed at comparable development ages and paired with a credible comparison group, are the minimum foundation for a causal claim. Until then, the most responsible formulation is also the most informative: inflow indicators are improving, while the claims leaving the system still include a costly and elevated litigated share.
Florida does not have one litigation number. It has a pipeline.
At the front of that pipeline, the indicators of newly initiated litigation are falling. At the back, carriers are closing a smaller book in which legacy litigated claims carry more weight. In the middle, wind and water claims, regional composition, missing-status improvements, carrier mix, closure timing, and cohort maturity shape what appears in any given report.
The market does not need to choose between “reform worked” and “litigation is still elevated” before it acts. It needs to ask a better question: elevated where, measured when, and against which denominator?
Once the clocks are named, the contradiction disappears. What remains is an operating agenda: keep the inflow moving in the right direction, make the runoff visible, and give claims teams the capacity to finish the expensive work still in the system.
About the author
Yo Sub Kwon is the CEO of Voltaire, which provides AI claims letters for P&C carriers. Voltaire helps claims organizations complete policy-supported correspondence faster, reduce manual drafting and template work, and make review workflows more consistent.